Quantcast
Channel: QSM SLIM-Estimate - Software Sizing
Viewing all 11 articles
Browse latest View live

Code Counters and Size Measurement

$
0
0

Regardless of which size measures (Effective SLOC, function points, objects, modules, etc.) your organization uses to measure software size, code counters provide a fast and easy way to measure developed functionality. If your organization uses Effective (new and modified) SLOC, the output from an automated code counter can generally be used "as is". If you use more abstract size measures (function points or requirements, for example), code counts can be used to calculated gearing factors such as average SLOC/FP or SLOC/requirement.

The QSM Code Counters page has been updated and extended to include both updated version information and additional code counters. Though QSM neither endorses nor recommends the use of any particular code counting tool, we hope the code counter page will be a useful resource that supports both size estimation and the collection of historical data.


Frequently Asked Questions About Software Sizing

$
0
0

Software is everywhere in modern life - from automobiles, airplanes, utilities, banks, to complex systems and global communications networks. They run the gamut from tiny applets that comprise just a handful of instructions to giant systems running millions of lines of code that take years to build.

Software professionals are at the front lines of this information revolution.  This post addresses Frequently Asked Questions about measuring the size of software applications after they’re finished and estimating the work for a project that has yet to be started. We hope it will help software professionals do a better job of describing what they are building for their companies as software continues to grow in strategic importance to our companies and to our daily lives.

Question:  What do we mean by the term, “Software Size”

Answer:  For starters, think of T-shirts – Small, Medium, Large, or Extra-Large, or houses that can range from a small summer cottage all the way up to a 20,000 sq ft Hollywood mansion on a sprawling estate.

So it goes with software. You can have a small program with a few cool features, or a huge, complex computerized trading system for the New York Stock Exchange comprised of millions of lines of code, and everything in-between.

Question:  I have a large project and its size is 20 people. Is that what you mean?

Answer:  Not quite. That’s actually the number of the people on your team, or number of staff resources on the project.  It’s not the amount of functionality, or the volume of software created by a team of that size. 

Question:  Ok, so you’re saying that small feature sets for a software program - or a long list of features - is what you mean by the size of the software. Do you also mean lines of code?

Answer:  That’s another way to look at it.  Generally speaking, to complete a project that satisfies hundreds of requirements or feature requests takes a lot more working code than a tiny applet with five simple features.  We talk about things like “Units of Need” which describe the software capabilities that people might request. These can be things like features and requirements/functionality.  An intermediate vocabulary that starts to translate these features into the technical world includes terms like technical requirements, Function Points, or in the Agile realm, Stories, and Story Points.

We think of “Units of Work” to describe what developers produce in the software realm, like the number of programs, objects, subroutines, and ultimately, working software code – to satisfy the “Units of Need” that customers ask for.  A team of system architects, designers, programmers, and testers ultimately create working software to produce this functionality, in a given programming language.  Computers run on software code – not feature lists.  This working code is what programmers - with their artful designs and technical prowess - design, code, and test.

Ideally, we want simple designs that are clean and elegant.  Simple designs, where possible, are often produced faster with less effort.  They also tend to be more reliable and easier to maintain.  The converse is a sloppy design with lots of “spaghetti code” that’s buggy, requires more rework and longer testing.  This often takes more time and costs more, in the long run.

Question:  If what you’re saying is true, wouldn’t you expect it to take less code to produce a feature, or as they say in Agile terminology, a User Story?

Answer:  Exactly!  Less code takes less time, requires fewer effort hours to build and test, and tends to be more reliable.  That means you don’t have to test as much, and you can finish sooner - hence you’re more productive.

Also, to understand these relationships – how much code it takes to produce a Function Point, a feature, or a User Story, can be very valuable.  It’s like a currency conversion from dollars to euros or changing units from miles to kilometers.  If you have a good handle on this conversion, which at QSM we call “Gearing Factors,” you can move from one realm to another fairly easily.  Early on in a project, if you think you have to build 40 to 50 features, you can come up with an assessment of the amount of software that might be required.

Question:  Should we count using Function Points? I heard that this is an industry standard.

Answer:  It depends on whether this metric is an appropriate fit for what you do.  In the 1980s, Alan Albrecht at IBM described the architecture for systems of that era using Function Points which are comprised of a CRUD environment – Create, Read, Update, Delete - against an underlying database.  That’s what mostly IBM mainframe batch processes performed.

If that’s the fundamental architecture for what you build today, then describing Units of Need in that vocabulary can work.  Ultimately, to deliver working software to deliver a certain number of Function Points also requires a certain amount of code.  (Counting Function Points is a laborious manual process.  Code counts can be automated with a tool.)

However, you might build software that flies airplanes, runs under a distributed architecture with wireless capabilities and online error checking and diagnostics, or something in the more current modern world that is a long way from a CRUD architecture on a mainframe.  In that case, Function Points might not be an easy fit.  They require manual labor as well as a specification that’s well documented and not outdated.  Many organizations don’t have that.

As we move more toward Agile methods, many teams prefer to describe features as User Stories - with each being described on a complexity scale such as Story Points.  These are also ultimately produced through working code.  If you find yourself in this world, that might be a better fit.

Read more of QSM's FAQs.

As managing partner at QSM Associates Inc. based in Massachusetts, Michael Mah teaches, writes, and consults to technology companies on measuring, estimating and managing software projects, whether in-house, offshore, waterfall, or agile. He is a frequent conference keynote speaker and is the director of the Benchmarking Practice at the Cutter Consortium, a Boston-based IT think-tank, and served as past editor of the IT Metrics Strategies publication. 

You can read more of Michael's work at his blog, Optimal Friction.

Function Points: A "Mousetrap" for Software Sizing?

$
0
0

Sometimes business life follows literature. Recently, I came across the following quote and I had to pause:

“Before we build a better mousetrap, we need to find
out if there are any mice out there.” - Yogi Berra

It reminded me of a conversation I had over lunch 15 years ago, when I was president of the International Function Point Users Group (IFPUG) and Charles Symons was president of the UK Software Metrics Association (UKSMA), where we were talking about the future of software sizing.  IFPUG is the inventor of the original method to size software using a measure called “Function Points.”  Charles is the creator of a similar UK method called Mark II function points and a co-creator of the Common Software Metrics International Consortium (COSMIC) sizing method that was, at the time, still in its infancy.  I’m paraphrasing with the words but I believe it captures the content of our conversation:

“The problem with function points,” Charles remarked, “is that they aren’t yet perfect enough.  What we need is a better mousetrap and the world will beat a path to our door.”

I disagreed saying “I don’t think that’s the problem at all – I think the problem is that world doesn’t yet see mice as a problem.”

Since then, there’s been marginal growth in function point interest (it goes in spurts), but I believe that both Charles and I were wrong in our predictions of the future, for different reasons.  Charles went on to develop COSMIC (now supported by measurement manuals as large as the IFPUG manuals supporting the original method) and gained some market following.  We, in IFPUG, spent money on marketing efforts that increased the interest in new markets (such as Brazil and Korea) and applications (such as outsourcing measurement.) BUT in the last 15 years, worldwide, the penetration of functional sizing remains below 10%. 

I believe that the software world does see a need to size software portfolios and projects, but hasn’t yet realized:

  1. There are alternatives to the still popular and unstandardized SLOC (source lines of code) measure;
  2. What function points are and how they can provide an objective measure of software size;
  3. Software size is independent of methods and is still relevant in new technology (agile methods propose effort based metrics such as story points);
  4. Most C-level executives want quick, inexpensive, and silver bullet measures that don’t cost time and effort to implement.  In addition, when measures such as function points are proposed, consultants often propose “exact hand counting” that turn off many potential adopters.

In addition, function points seem to be one of the best kept secrets in software measurement: as many as 90% of the companies I meet during project management training have never heard of function points.  I believe the biggest challenge always has been: “While the world knows that mice pose a problem, few people know anything about mousetraps.”

Function Points create solutions

The “mice” in software development is the elusive size of the software product.  Everyone who buys or builds software wants to know how big it is (quantitatively) because the larger it is, the more it will cost and the longer it will take to build.  Traditionally, source lines of code (SLOC) in terms of logical source statements were used to quantify software size, however, SLOC rewards “spaghetti” style programming where the software size grows with the number of “lines.”  There are several problems with SLOC counts:

  1. Programmers who build inefficient software (i.e., routines with lots of extra source statements) appear more productive.
  2. Every time the programming language changes, the SLOC count will be scaled differently (i.e., 10 lines of Java code do not deliver the same value as 10 lines of Cobol code).
  3. There are no standards for counting SLOC.

Function points (FP) are a measure of software size that is independent of the programming language used to build the software, and is based on quantifying “what” are the business processes and procedures  provided by the software (i.e., what the software does in terms of functionality.)  IFPUG maintains the counting methodology (the steps and the values to assign to functions) and the method has stabilized to the extent that there are major industry databases of completed FP counts for all kinds of delivered software.

Function points are akin to square feet in building construction and provide an objective business focused unit of measure that is easily understood by both the business and software developers.  In the same way that estimates can be made to build a certain type of building based on its size (square feet) plus the building code, type of building, building approach and other factors, software development estimates can be made to build a certain type of software based on its size (function points) plus its non-functional requirements (quality, performance, etc.), methodology, and other factors.

Function points provide a new “mousetrap” that is economical, easy to learn, and consistently solves the software sizing problem.  Since mice (software size) continue to be a problem – why not take a look at function points as a proven solution?

For a primer on function points and how they can be used, please contact us.

Ask Carol: With Software Sizing, If You Don't Know the What, You Can't Estimate the How

$
0
0

Software Sizing and Project EstimationDear Carol: 

I’m a developer in our IT department and we know that project estimating is a big deal for our customers.  Somehow, no matter what we do, we can't seem to get it right.  We do know that project size is an important input to good estimating  and our gut feel is that if we get sizing right, we’ll do better estimates!  I know you recommend using function points, but I’ve also been reading a lot about use case points, story points, SLOC, sizing by analogy, T-shirt sizing, COSMIC and other sizing metrics.  We do a mix of waterfall, agile, iterative and even Kanban to do our projects so what’s the best choice for sizing to get the best results? 

- Size Challenged in Milwaukee

Dear Size Challenged:    

Sometimes I wonder if the internet and the proliferation of (mis)information is a good thing. Before the internet, our choices (for sizing or estimating or anything) were limited and we didn’t have such an overwhelming task to first sift through many options before taking action.  Your list of software sizing choices is an example of this. 

You are right that sizing is an important (maybe the most important) input to estimating, but before I recommend the “best” choice for sizing, I’d like to ask you, what may seem like an obvious question: “what is it you want to estimate?”  This is not a flippant question – it is a critical one and merits consideration.  Now, before you answer with "cost, effort and schedule," think about what is the object of estimation – a project, iteration, a sprint, a release, a use case or what?  If you don’t know (the scope of) what you want to estimate, you can’t even begin to estimate the how (in terms of how long (duration), how much ($) or how much effort.) 

Too often, we (including me!) go into estimating without really considering that consistency is the key to good estimates.  If I want to estimate a project, what is this thing called “project” and does it match up with the definition of a project for the estimating tool or equation I am using.

Consider this: If I have a construction estimating equation (this is the basis of most software project estimating models) that defines a project consistent with the Project Management Institute (PMI) definition of project...

“Temporary endeavor undertaken to create a unique product or service.”

...and I want to know the duration, cost, or effort to do several use cases, the first step would be to ensure that the “several use cases” matches up with the definition of project. In fact, several use cases may or may not result in a unique product or service. A project starts with a known/defined product or service scope (which can be sized) and ends either at the end of development (i.e., installation) or after installation. If the “several use cases” will go through the project life cycle and result in a working product, then it would qualify as a project and I can then figure out the best inputs for the estimating model.

Specificity of what is included in a project is also an important consideration and is one that skews estimates all the time. For example, if it is unclear at the time of an estimate whether or not the development of a subsystem is to be included in an estimate, obviously an estimate that excludes it will be wrong if such work was to be included. This is similar to saying that we aren’t sure whether to include a family room in the house construction and so we exclude it from the estimating scope – obviously if the resultant project includes the family room area, the original estimate will be wrong. So, being specific (and documenting) what is included and excluded from the estimating scope is also critical to getting estimates right.

I hope that this makes sense.  Any of the sizing methods you mention may be suitable for use in the estimating equation (it depends on the model or tool you are going to use) – but the first and most important step is to figure out what it is you are estimating. 

Once you know what you want to estimate, the how to size your software becomes a matter of consistency.  See the other posts in Ask Carol for how to select which sizing option best suits your needs. 


QSM hosts a free advice column for software professionals who seek help to solve project management, communication and general software project issues. Carol Dekkers is a QSM consultant and IT measurement and project management expert who speaks internationally on topics related to software development. Send your questions to Ask Carol!

Introducing QSM's Software Sizing Infographic

$
0
0

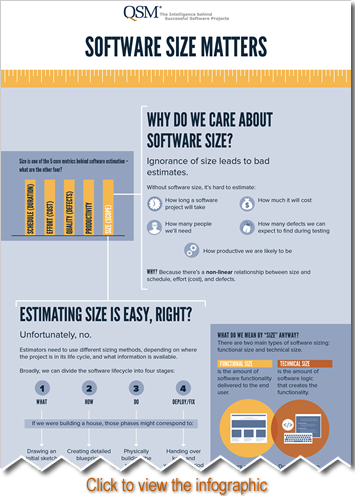
QSM Software Sizing InfographicSoftware size, the amount of functionality in a given software release, is arguably the most important of the five core metrics of software estimation.  There is little point in tracking effort, duration, productivity and quality if you are unable to quantify what you are building.

Yet, despite its critical importance, software sizing is often a difficult concept for many to understand and use properly in the estimation process.  Sometimes a picture is better than 1,000 words.  With that ideal of visual simplicity in mind, we developed a software sizing infographic that helps explain:

  • Why we care about size
  • Challenges in sizing
  • When size should be measured during the software development life cycle (SDLC) to narrow the cone of uncertainty
  • The difference between functional and technical size 
  • The most popular sizing methods and when to use them

The infographic begins by introducing the five core metrics of software estimation (size (scope), schedule (duration), effort (cost), quality (defects) and productivity) and the nonlinear relationship between them.

Next it outlines the four generic phases in the software development life cycle and why estimators need to use different sizing methods, depending on where the project is in the life cycle and what information is available.  At each stage of the software development life cycle the cone of uncertainty narrows and the number of sizing techniques that can be used increases as more information is known about the project and the required functionality.

It then introduces the concepts of functional size and technical size and how every sizing method can be normalized to a common unit. 

  • Technical size is the amount of software logic (source lines of code or configurations to a commercial off-the-shelf package (COTS)) that creates the functionality.  All technical sizing methods can be converted to implementation units (IUs).  An IU is equivalent to writing one source line of code or one technical step in configuring a commercial COTS package.  Developers typically care more about technical size than functional size because it is a measure of how much technical work they need to do.
  • Functional size is a technology-independent measure of the amount of software functionality delivered to the end user.  All functional sizing methods can be converted to function points (the most widely used ISO standard for functional sizing is the International Function Point Users Group (IFPUG) method).  Function points can, in turn, be converted to IUs based on the QSM Function Point Languages table.  End users typically care more about functional size than technical size because it represents the software functionality that provides business value to them. 

Building on the above concepts, it next provides a table of the most common sizing methods with definitions. 

  • Examples of functional sizing methods include higher levels of abstraction (e.g. business requirements, epics or use cases), medium levels of abstraction that can be prioritized for planning purposes (e.g. functional requirements, functional capabilities or user stories) and low level ISO standard function point techniques (IFPUG, COSMIC, MARK-II, FISMA, NESMA).
  • Examples of technical sizing methods include business process configurations and RICEFW objects, technical components (screens, reports, forms, tables, etc.), source code files and source lines of code.  (Note: RICEFW is an acronym that stands for reports, interfaces, conversions, enhancements, forms and workflows which represent customizations to a COTS package.)

Finally the infographic summarizes the whole sizing process by overlaying the cone of uncertainty with the four software life cycle phases and the recommended sizing methods for each phase.

When combined with our workshop in software sizing, this infographic is a useful visual reference that puts you on the fast track to more successful estimation.  

View the full infographic!

How Much Software Is in your Car? From the 1977 Toronado to the Tesla P85D

$
0
0

It’s easy to imagine there is a lot of complex computer software code required to operate and control a fully autonomous self-driving car, such as the prototype recently unveiled by Google, and that advanced systems engineering and software life cycle management techniques are required to successfully manage its development.  However, you may be surprised to find out that nearly every vehicle under 30 years old on the road today also depends on computer software - and lots of it.

According to an IEEE Spectrum article by Robert Charette entitled: “This Car Runs on Code,” the first production car to incorporate embedded software was the 1977 General Motors Oldsmobile Toronado which had an electronic control unit (ECU) that managed electronic spark timing.  By 1981, GM had deployed about 50,000 lines of engine control software code across their entire domestic passenger car line.  Other auto manufacturers soon followed the same trend.   

Automotive Software Size

1977 General Motors Oldsmobile Toronado (image source)

Around the same time software was being used for the first time in cars, QSM, Inc. founder, Lawrence Putnam, Sr. was discovering the “physics” of how engineers build software by successfully modeling the nonlinear relationship between the five core metrics of software product size, process productivity, schedule duration, effort and reliability.  One of his first presentations of his findings entitled, “A General Solution to the Software Sizing and Estimating Problem” was given at the Life Cycle Management Conference of the American Institute of Industrial Engineers in 1977.  In 1978 Mr. Putnam invented the Software Lifecycle Management (SLIM) tool based on these algorithms and began collecting a benchmark database of historical software projects. 

Fast forward to the present. The amount of software used in all industries including the automotive industry has increased exponentially in both size and complexity.  Premium cars like the Mercedes-Benz S-class now depend on millions of lines of code running up to 100 networked ECUs throughout the body of the car which control and monitor everything from the powertrain to the airbag system.  Even lower end cars have up to 50 ECUs.  In a QSM productivity benchmark study for a major automobile manufacturer, we found that powertrain software can be just as sophisticated as real-time, embedded systems found in military and aerospace industries.  

Meg Selfe Divitto, former GM powertrain engineer and IBM Vice President of the Internet of Things, was quoted in an Embedded article as saying that the Volt had 10 million lines of code.  While a significant portion of that was probably reused or auto generated from model driven development, it is nevertheless a massive amount of code greater in size than the avionics software in the F-22 Raptor and Boeing 787. 

Few companies leverage software more than Tesla Motors, a U.S. company founded in 2003 and named after electrical engineer and physicist Nikola Tesla.  Its CEO, Elon Musk, made his fortune in software startup companies and Tesla Motors boasts cutting-edge software as a critical part of almost every aspect of its business.  With an intense focus on agile innovation, the company began production of the Tesla Roadster in 2008 and the Model S sedan in 2012 - both 100% electric cars that took the use of software to a whole new level.  The Model S has a 17 inch touch screen with a Linux-based computer system that controls nearly every function of the car - from performance to the entertainment system.  In fact, there are only two manual buttons: one for the hazard lights and one to open the glove box.  Software updates, which include both bug fixes and new functionality, are pushed to the car remotely via a 3G cellular network.  

Tesla Automotive Software Size

Tesla Model S 17" Touchscreen

Embedded software is the secret sauce in the electric powertrain of the Model S and one of the top areas of investment, according to CTO JB Straubel in an interview with PCWorld.  The newest dual motor P85D version released in late 2014 digitally adjusts torque at the millisecond level between the front and rear motors to achieve a staggering 864 foot-pounds of torque (more than a twin turbo V-12 engine), 691 horsepower and 1 G of lateral acceleration going from 0-60 mph in 3.1 seconds.  YouTube videos of the Tesla Model S P85D drag racing supercars like the Ferrari 458 Italia have gone viral.

Today’s auto manufacturers have truly become software companies, presenting both opportunities and challenges.  With all of this complex software comes the need for systems engineering and sophisticated project, program and portfolio management carefully balanced against the triple constraint of schedule, effort/cost and quality.  Unlike some other industries, auto industry executives do not have the luxury of ignoring any one part of the triple constraint.  Being late to market with innovative technology may mean that a competitor captures the majority of market share.  If development effort and costs are too high, it puts more pressure on sales volume to reach an acceptable margin.  Software reliability issues can result in expensive recalls and even lawsuits that tarnish a company’s reputation and impact future sales.

Thankfully there are quantitative software life cycle management techniques that can help address some of these management challenges.  At QSM, we have successfully applied these techniques to complex software projects for over 35 years in every domain (business, engineering, real-time embedded) and industry sector, including the automobile industry.  Along the way, we have collected a historical benchmark database of over 10,000 projects which is used to calibrate our SLIM tool.  Our QSM Software Almanac: 2014 Research Edition provides some of the latest research from this database.

So what does the future hold for the automotive industry?  Some cars in production today like the Tesla Model S already offer advanced safety features and autopilot capability where software integrates data from cameras, radar, and 360 degree sonar sensors with real-time traffic updates.  However, a ten year look ahead gives us a concept cars like the Mercedes-Benz F015 Luxury in Motion that are so advanced they look like they’re straight out of a science fiction movie.  Other visionary efforts such as Project 100 are going beyond cars and rethinking the entire transportation system.

Will these concepts become reality ten plus years from now when my young children are driving age?  It’s hard to say, but one thing is almost certain: there will be a lot of complex software involved and the companies that succeed will be the ones that combine innovation with successful execution and a thorough understanding of the five core metrics of software development.

Webinar - QSM's Software Sizing Infographic: A Visual Aid for Understanding Software Size

$
0
0

On Thursday, March 26th at 1:00 PM EDT, Joe Madden will present QSM's Software Sizing Infographic: A Visual Aid for Understanding Software Size.

Software size, the amount of functionality in a given software release, is arguably the most critical of the five core metrics of software estimation. There is little point in tracking effort, duration, productivity and quality if you are unable to quantify what you are building. Yet, despite its critical importance, software sizing is often a difficult concept for many to understand and use properly in the estimation process. In this webinar, Joe Madden will give an overview of QSM's Software Size Matters Infographic, which addresses the challenges of measuring software size and identifies the most popular sizing methods and when to use them. With over 17 years of software sizing experience, Joe will provide case studies and best practices for real world application.

Joe Madden currently leads the QSM consulting division which has grown dramatically in the past six years and offers a wide range of professional services. These include the software estimation center of excellence, function point analysis, program and portfolio management, independent verification and validation, vendor management, benchmarking and process improvement, and expert witness services. A longtime client of the QSM SLIM Tools Suite and co-author of the book, "IT Measurement: Practical Advice from the Experts," Joe has more than 23 years of experience in IT management and consulting.

Watch the replay!

Software Project Size and Road Construction

$
0
0

Software Project Size and Road ConstructionI have been a software project estimator for 20 years.  Like many people who have worked a long time in their profession, I find myself applying my work experience to other events in my life.  So, when a family member tells me that he or she will be back from a trip into town at 3:30, I look at their past performance (project history) and what they propose to do (project plan) and add an hour.  Usually, I am closer to the mark than they are.
I live on a narrow peninsula that juts into Puget Sound.  There is only one road that connects me to the nearest gas station or grocery store which are three miles away.  This year that road is undergoing a construction project that is adding bicycle lanes on both sides.  Since I am a bicyclist, I don’t complain about the inevitable traffic delays this is causing (long term thinking/delayed gratification).  During one of those 20 minute delays my mind began to mull over how I would estimate this road construction (enhancement) project.  Based on past local road construction history, if I simply estimated by analogy, I would be reasonably certain that the project will overshoot both schedule and budget which normally represent a best case scenario.  But, I am a parametric estimator and began to consider how I would size this.  Obviously, the amount of road in the project (the user specified deliverable) would be an important part of the equation.  But, it would be only a part.  A great deal of preparation (configuration) would be required before any pavement is laid.  In fact, six weeks into this project all of the work has consisted of digging ditches, inserting drainage pipes, refilling those same ditches, compacting and leveling them.  A good size estimate would need to incorporate that, too.

When estimating software, we often base the project size on the deliverable:  how many function points, or lines of code, or reports/screens/interfaces/etc. the project proposes to deliver.  Then we adjust the productivity based on the difficulty of delivering these (environmental factors) to produce a schedule/cost/effort estimate.  For many software projects, this approach works well.  However, when configuration comprises a significant component of the work to be done, it too should be incorporated into the project size.

A few years ago, QSM worked with a large vendor of ERP systems to help them more accurately estimate the installations of their products.  They had been doing bottom-up spreadsheet estimates and were dissatisfied with the results.  They were dubious that a product designed to estimate software projects would be useful for them since, as they said, “we don’t develop software.  We implement systems.”  But, they had run out of options and were willing to give us a try.  We analyzed scores of their completed projects and came up with these results:

  1. To their surprise they did develop software: lots of it.  Most customers required modifications to the vendor’s products which required them to code extensions, reports, new screens, and interfaces.  In fact, the software code comprised 40-60% of the size.
  2. When we combined the configuration and developed code to determine project size and modeled the completed projects, the patterns for schedule and effort were similar to those for Business IT projects in our historical database.
  3. Parametric estimation using SLIM-Estimate was a good fit for the ERP implementations they needed to estimate.
  4. Accurate project size needed to incorporate both the configuration and customization components.

So, for my local road enhancement project, project size consists of the final delivered product and a whole lot of things they need to build to get there (configurations).  Since I am not a road engineer, I will not be doing a parametric estimate on this project and will estimate it by analogy and past history.  These indicate that although the project is slated to complete by September, I don’t think I’ll be using those new bicycle paths until next year.


Averages Considered Harmful

$
0
0

Arithmetic mean (aka average) is often a misleading number. One reason for this is that mean is sensitive to outliers. A very large or a very small value can greatly influence the average. In those situations a better measure of center is the median (the 50th percentile). But there is a second huge pitfall awaiting anyone using average for estimating or benchmarking: software size.

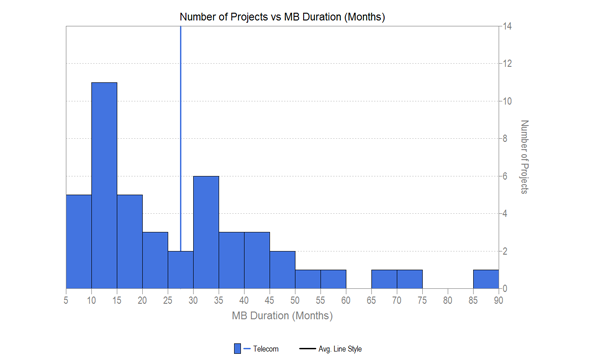
Even though we know that software size has a major influence on the key metrics (e.g., effort, duration, productivity, defects) many people insist on reporting and comparing and using the average value. Let’s look at an example. Consider a sample of 45 completed telecommunications application type projects. Picking one of the key metrics already mentioned, duration of phase 3, we can generate a histogram and calculate the mean. The average duration is 27.5 months. Does this tell us anything useful?

Number of Software Projects vs. Duration

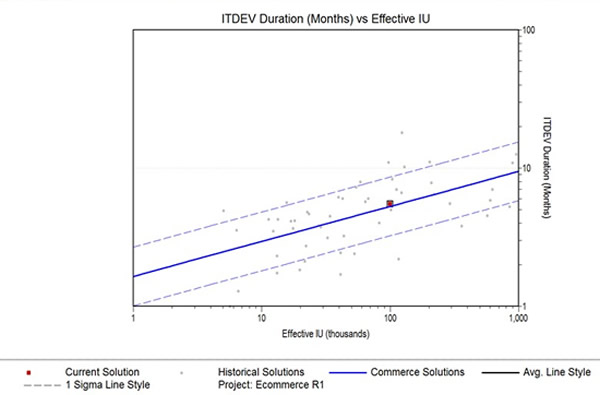
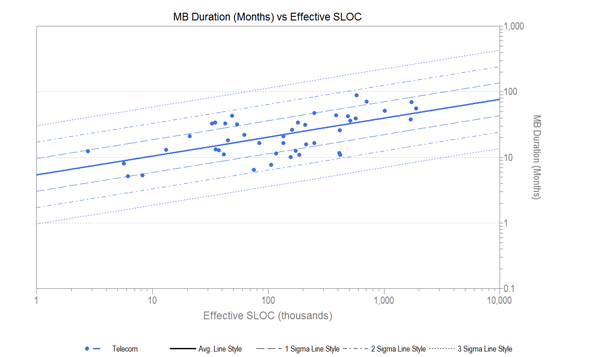
The histogram of durations shows a skewed distribution (many projects have a shorter duration, few have a long duration), so we will need to do some sort of normalization before the average is a measure of center.  And even then, what about size?  In a typical SLIM scatterplot of duration versus size for these projects, we can see that in general larger projects take longer than smaller ones.  

Software Project Duration vs SLOC

Even though the overall average duration is 27.5 months, a 10,000 SLOC project might be expected to have a duration of 10.5 months, while a 1,000,000 SLOC project about 39 months.  Both very far from the “average” indeed!

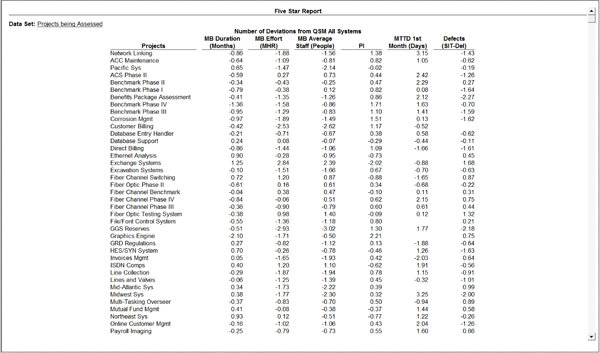
A better way of evaluating an individual project, rather than comparing its duration (or other metric) to the average, would be to compare it to the trendline.  This results in a number called a standardized residual.  In other words, it is the number of standard deviations the project falls above or below the center line.

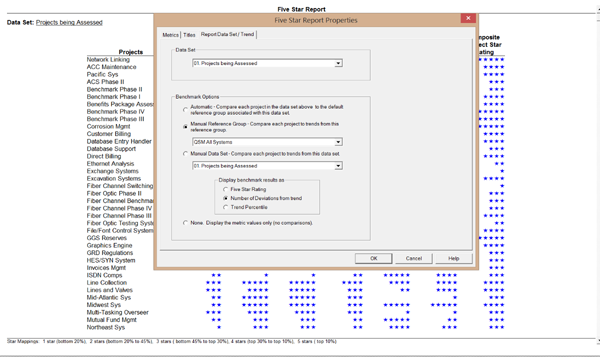
You can obtain the standardized residuals for your data set quite quickly from SLIM-Metrics.  There is a check box on the Five Star Report which will output the numbers (rather than the stars).  Here is a screenshot of the pop up window for a set of training data.

SLIM-Metrics

This will produce the list of normalized factors for the metrics you have selected, which can also be exported to the tool of your choice.

SLIM-Metrics Report

To sum up, most SLIM estimators have used the historical comparison charts to compare estimates or project performance against a historical set of projects and their historical trendlines.  This is also very helpful when selecting a PI for an estimate, or doing feasibility analysis.

The standardized factors are very useful when doing benchmarking, such as any time someone is tempted to grab and use an overall average for reporting or estimating.  Don’t just use the average, normalize it!

The Lowly Line of Code (Part One)

$
0
0

“I'm sorry, Dave. I'm afraid I can't do that” – HAL 9000[1]

Source lines of code (SLOC) is a measure of software size, in use since the 1960s. This blog post describes various uses of SLOC from the perspective of software measurement.

There seems to be a love/hate relationship with the line of code measure. Despite its broad and continuous use (or perhaps because of it) SLOC seems to get the blame for many a failed software project, process improvement or software metrics initiative. There are even those who claim that “…in many situations usage of LOC metrics can be viewed as professional malpractice…”[2]But, as you will see, SLOC has many benefits, when used intelligently.

The purpose of SLOC in a measurement practice is simply to capture software size. Nothing else. Because of this purity, SLOC can be combined with other measures and software cost estimating relationships to estimate effort, duration or productivity (more in a future post). Because of early misuse of SLOC, all sorts of alternatives to SLOC (e.g., Function Points and more than 35 variants, Story Points, Object Points, Use Cases and many, many others) were invented in an attempt to “fix” SLOC, but in the end these only complicated matters. Most of these measures try to accomplish too much. They include concepts such as functionality, complexity, user behavior or elements of architectural design. As a result, only a few of these measures survive today. And none have the simplicity, understandability or clarity of intent that SLOC enjoys. In fact, no other measure better answers the question: How much code?

The much-maligned SLOC measure has been defined and redefined many times over the years, but in practice, the definition of SLOC falls into one of two broad categories: physical source statements or logical source statements. Both definitions typically exclude blank lines, comments and non-delivered code.

Many programming languages allow one statement to be divided into more than one physical line, as the following code example illustrates:

Source Lines of Code

Likewise, multiple statements may be combined onto a single physical line:

Physical line of code

Regardless of coding style, both definitions have value. That said, the software industry has pretty much decided that logical SLOC is better than physical SLOC, when using SLOC as a proxy for effort.

Much more important than a precise definition of SLOC (or any measure), however, is its consistent usage in a measurement program. Even if you used the worst definition of SLOC known to humanity, but you use it consistently, you would be better off than using the SLOC definition currently in vogue, and changing with the times. By sticking with consistent measures, comparisons between projects (across all time) and trends within a project are much easier to observe.

Next: estimating effort, duration and productivity by combining SLOC with other measures and cost estimating relationships.


[1] 2001, a Space Odyssey. Dir. Stanley Kubrick. Metro-Goldwyn-Mayer, 1968.

[2] Jones, Capers, “A Short History of Lines of Code (LOC) Metrics,” Version 2.0, May 10, 2008

How Can We Fix the Disconnect Between Software Vendors and Their Clients?

$
0
0

QSM is a leading demand and vendor management company. We have many years of experience working with outsource management professionals, evaluating software project vendor bids and monitoring the development progress of those bids for our clients. We are often hired to help them with their vendor management process because their past projects have failed to meet cost, effort, reliability, and duration expectations. 

It starts with the independent estimate and bid evaluation process. Our main clients are CIOs, PMO managers, purchasing managers, software project managers, and business stakeholders. Our clients will usually have a large software development or package configuration project pending. They are initially trying to figure out which vendor to hire. Vendor A will offer them a bid of 20 million dollars with a specified duration commitment and Vendor B will offer them a bid of 30 million dollars with a different duration commitment. How do we know which vendor to choose? Can Vendor A really finish with a lower cost and shorter schedule? Is the system going to work when it’s done?

The way it usually works is the client will make a decision based on their experience or gut feel. Or if they have already worked with a specific vendor in the past they will go with that vendor again based on some personal relationships that have evolved. Then the problems start. The work that was promised doesn’t get done within the promised time or the promised budget. The vendor then comes back and says they will add people to the project and everything will be ok. The client approves the revised project plan since they don’t have a way to confirm the accuracy of the revised proposal. Then even bigger problems start. More money is wasted, the schedule slips even more, and relationships sour.

Does this story sound familiar? It doesn’t have to be that way. By putting some software project measures in place and by leveraging some historical data you can save your company millions of dollars and improve the client to vendor communication and relationship. How do we get started saving ourselves all this money, time and aggravation?

First, the client needs to require that their vendors meet certain criteria. One of the requirements that is necessary is measuring the size of the system. Often clients and vendors think sizing is challenging but there are some very straightforward ways of determining size using information that clients already have available. Some of the standard size measures include lines of code, function points, user stories, configuration units, or use cases to name a few. The important point here is to be talking the same language as the vendor. Make sure the vendor knows how to measure the size of the system and make sure that both sides are doing it the same way.

Next, we need to make sure that there is a way to measure vendor productivity. We need to use historical data when measuring productivity. QSM uses what we call a Productivity Index which is calculated using size, duration, and effort from historical projects. With the Productivity Index we can empirically determine how vendors have performed in the past. Make sure that you require that historical data be provided as part of your RFP. If the vendor doesn’t have historical data we can use QSM industry trend lines or historical data from your own organization.

Once we have size and productivity parameters in place, then we need to forecast the cost, duration, and reliability using a parametric estimation model: a model that can also look at multiple what-if scenarios and a model that can sanity check the estimates with industry trends. We want to have access to industry data to make sure that the bids are competitive and to make sure that promises are realistic. In the chart below we can see the red data point which represents a vendor bid and how that vendor bid compares to an industry trend line of similar projects. The grey data points represent historical projects from the vendor or the client themselves. This type of analysis allows us to determine if the bid is reasonable.

Software Vendor Industry Trendline

We also want to make sure that the estimation model that we use can assess project risk. In addition to seeing the vendor’s proposed cost, duration, and reliability estimates, we also want to see the chance that the vendor has of achieving these estimates. In the chart below we can see that Vendor A has less than a 60% chance of achieving their project bid.

Software Vendor: Risk and Balanced Probabilities

These are some basic tools to implement. For added insight into RFP language, making the vendor management process repeatable across the IT project portfolio, and negotiation techniques specific to project monitoring, it is recommended to hire an expert. Someone that does this professionally can see things below the surface when it comes to data analysis and contract negotiations.

By implementing some software project measurement practices and working with a vendor management professional you can fix the disconnect between your company and its vendors, saving a lot of time and money in the process.

Viewing all 11 articles
Browse latest View live